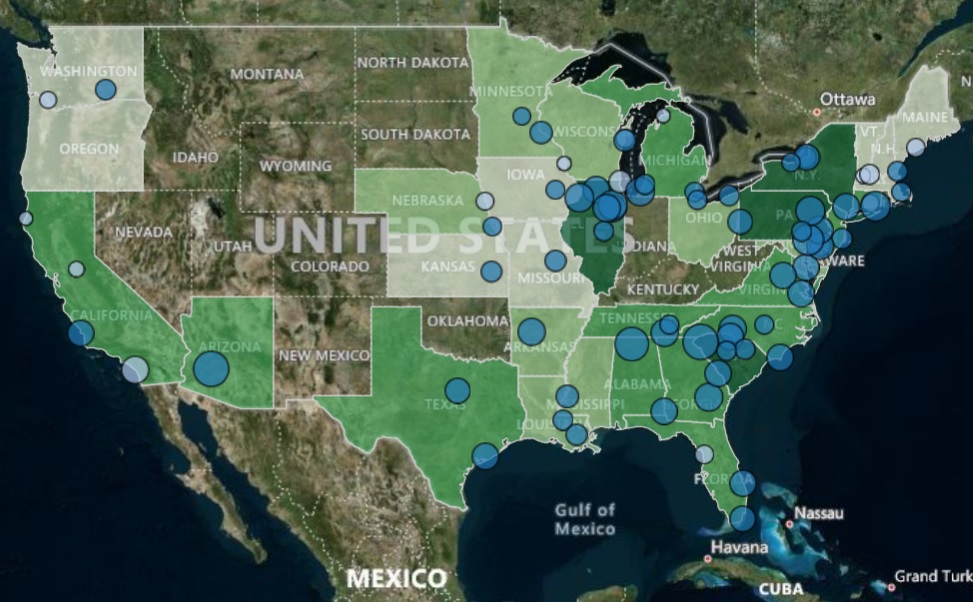
This map displays the current locations of stored inventory of SUNF across the United States. Operated & Maintained by Oak Ridge National Laboratory. Sponsored By the Department of Energy. Please scroll down to United States Stored Used Nuclear Fuel Sites and the Future Recycled UNF Electrical Energy Potential to see the amazing amount of future fuel already just sitting here!!
Waste to Energy is not a new concept by any means. In fact there are many states using Biomass or Biofuel, which is derived from using waste from crops, animals to produce energy. However, the fact is that burning biomass is neither clean nor renewable and it should be left in the past with fossil fuels.”
Nuclear – Waste to Energy, however is a clean and carbon free energy source that has not been fully utilized. By recycling the 97% uranium still unused whether by Fast Reactors or other methods, the United States would not have to depend on foreign sources or even need to mine for uraniun ore to process.
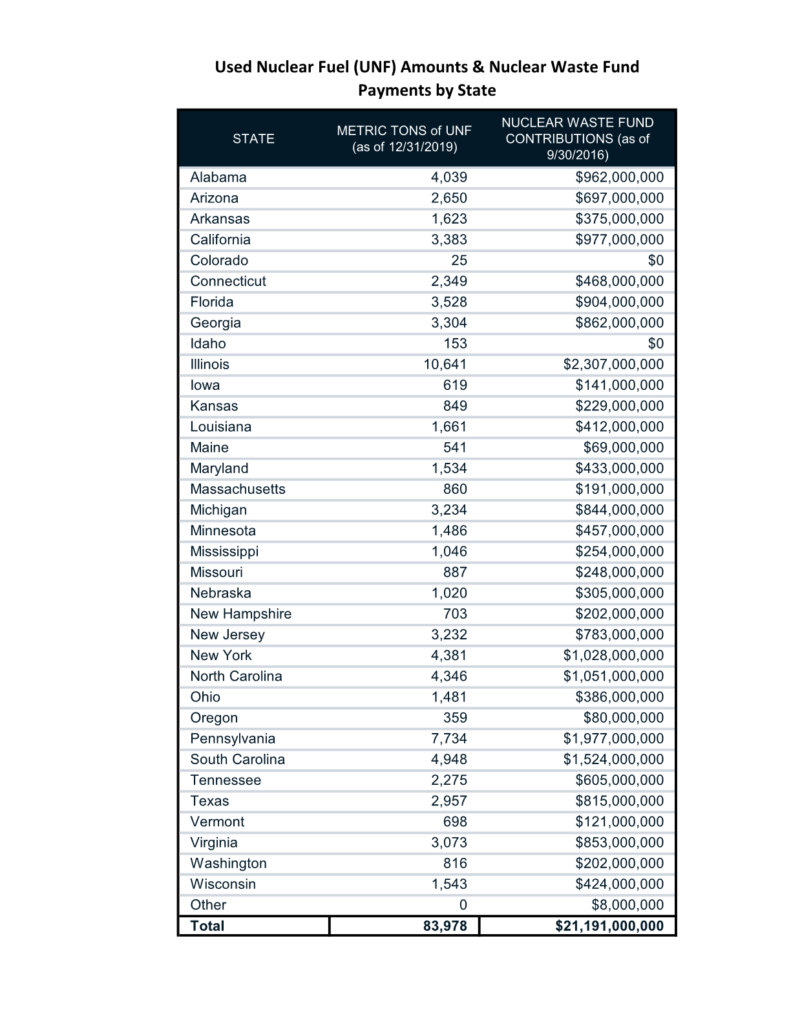
All Utility Rate Payers in these states in the chart to the left, have actually used electricity generated by a nuclear power plant and paid a portion of their bill into a fund created by congress called “the Congressional Nuclear Waste Fund”. The fund was created in 1983 and funds were collected until 2014 when a lawsuit stopped the collections, but did not refund the money already collected.
This money can only be used for the purpose of dealing with SUNF!
- This amount of money was collected by the US Government directly from electricity rate payers to take care of the disposition of “nuclear waste” from 1983 until 2014.
- No effective action has been taken on this issue despite the expenditure of more than $10 billion.
- The amount of money in this fund has risen to about $45 billion as interest has increased over the many years.
- NO solution exists today to solve this issue, all because the US Government took responsibility and spent the money to no effect.
- Thankfully, the money is still there and can be used for positive action, yet, still, no solution has been established after almost 40 years.
- This existing fund is sufficient to move the existing recycling technology to commercial viability.
- All we need is one Governor to agree to accept slightly used nuclear fuel (SUNF) in return for an applied science, tech-transfer National Laboratory and other benefits.
- Since the energy production business in the US (all energy) is about $1 trillion per year, it is easy to imagine at least a $10 billion per year industry in next generation clean energy reactor development.
- We only need to get this method to one Governor. It is important for you to help us get this message to the right ears. Our grandchildren and their grandchildren will thank you.

Department of Energy, on the La Hauge, France Vitrified UNF Storage Area.
United States Stored Used Nuclear Fuel Sites and the Future Recycled UNF Electrical Energy Potential
This Section will reveal the amount of Slightly Used Nuclear Fuel (SUNF), in Metric Tons (MT), at all Currently Running and Closed Nuclear Power Plants across the United States. At each site we will also reveal the potential energy for that states current electric useage (as of December 31, 2019) if the SUNF was recycled in a Fast Reactor in the future (Unless of the Feds waste more of you tax dollars to dispose it someplace where folks will not want it!).
NOTE: I intend on completing the aerial photos of the freestanding “SUNF” at each site shown below. I would also like in the future to reveal the amount of Coal Fired Power Plants pollutants that can be eliminated by replacing those plants in each state with Fast Reactors fueled with SUNF!
Source: Energy Information Administration, Department Of Energy, Gutherman Technical Services & Clean Air Task Force Data as of December 31, 2019.
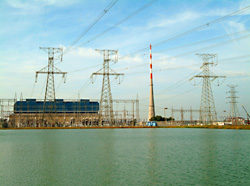
Browns Ferry Nuclear – Alabama
Alabama’s 2 Plant SUNF total – 4,039 MT
State Potential Energy + 348 Years
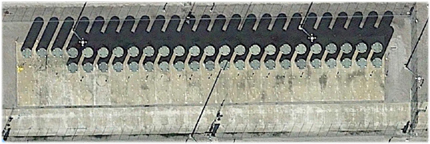
Farley Nuclear Plant – Alabama
Palo Verde Nuclear – Arizona
Arizona SUNF total – 2,560 MT
State Potential Energy + 287 Years
Arkansas Nuclear – Arkansas
Arkansas SUNF total – 1,623 MT
State Potential Energy + 309 Years
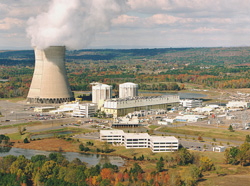

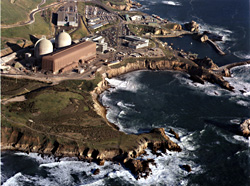
Diablo Canyon – California
California’s 2 running & 2 Closed
4 Plant SUNF total – 3,383 MT
State Potential Energy + 206 Years
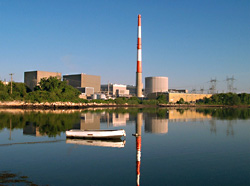
Millstone Station – Connecticut
Connecticut SUNF total – 2,349 MT
State Potential Energy + 721 Years
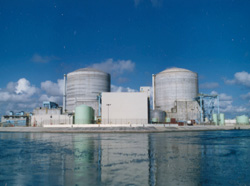
St. Lucie Plant – Florida
Florida’s 2 plant SUNF total – 3,528 MT
State Potential Energy + 176 Years
Turkey Point Nuclear – Florida
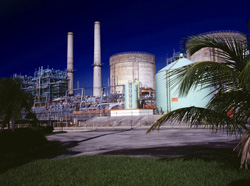
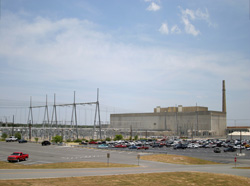
Edwin Hatch Nuclear – Georgia
Georgia’s 2 plant SUNF total – 3,304 MT
State Potential Energy + 315 Years
Vogtle Electric – Georgia
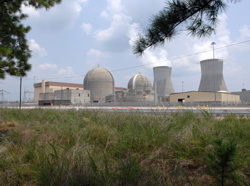
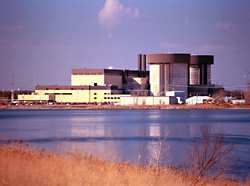
Braidwood Station – Illinios
Illinios 6 plant SUNF total -10,641 MT
State Potential Energy + 709 Years
Byron Station – Illinios
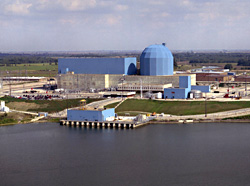
Clinton Power Station – Illinios
Dresden Nuclear – Illinios
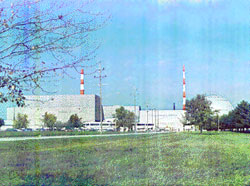
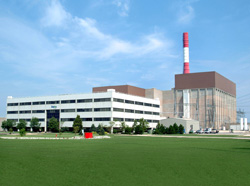
LaSalle County – Illinios
Quad Cities Nuclear – Illinios
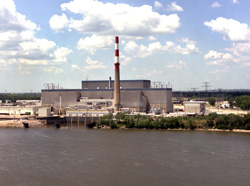
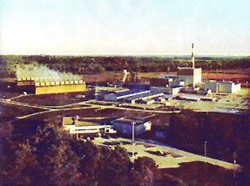
Duane Arnold Energy – Iowa
Iowa SUNF total – 619 MT
State Potential Energy + 123 Years
Maine –
Maine SUNF total – 541 MT
State Potential Energy + 634 years
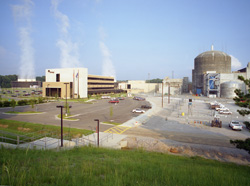
River Bend – Louisiana
Louisiana 2 Plant SUNF total – 1,661 MT
State Potential Energy + 204 Years
Waterford Station – Louisiana
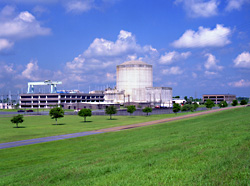
Maine (Closed)
Maine SUNF total – 541 MT
State Potential Energy + 634 Years
Calvert Cliffs – Maryland
Maryland SUNF total – 1,534 MT
State Potential Energy + 479 Years
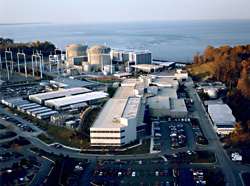
Massachusetts – (Closed)
Massachusetts SUNF total – 860 MT
State Potential Energy + 491 Years
Donald Cook Nuclear – Michigan
Michigan 2 Plant SUNF total – 3,234 MT
State Potential Energy + 340 Years
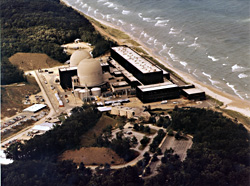
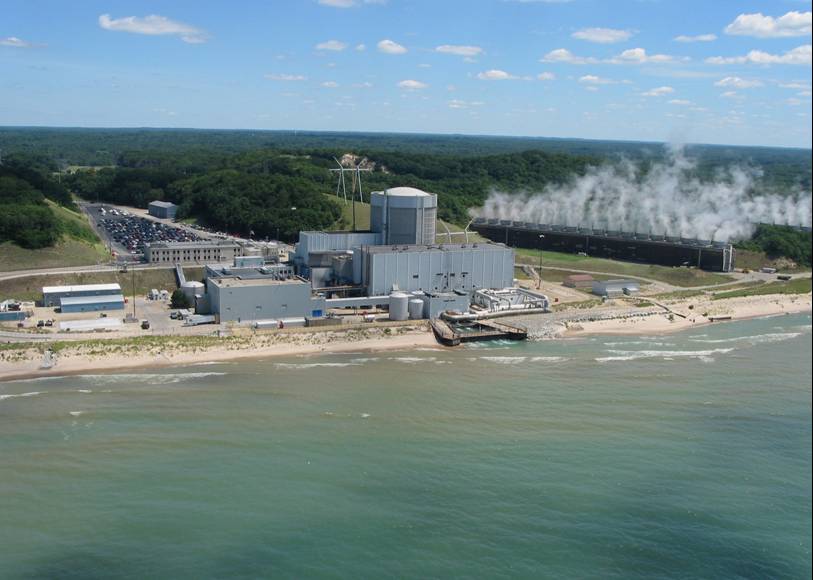
Palisades Nuclear – Michigan
Monticello Nuclear – Minnesota
Minnesota 2 Plant SUNF total – 1,486 MT
State Potential Energy + 307 Years
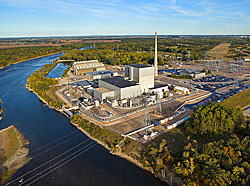
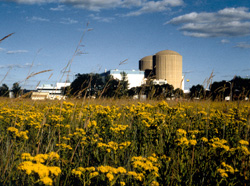
Prairie Island – Minnesota
Grand Gulf – Mississippi
Mississippi SUNF total – 1,046 MT
State Potential Energy + 195 Years
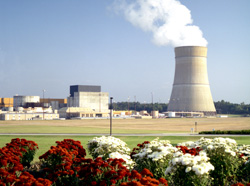
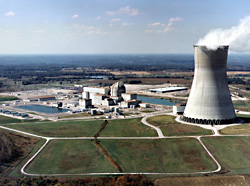
Callaway Plant – Missouri
Missouri SUNF total – 887 MT
State Potential Energy + 139 Years
Cooper Nuclear – Nebraska
Nebraska SUNF total – 1,020 MT
State Potential Energy + 336 Years
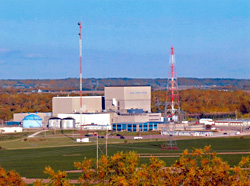
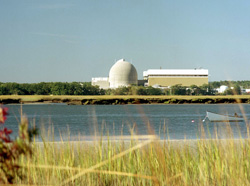
Seabrook – New Hampshire
New Hampshire SUNF total – 703 MT
State Potential Energy + 479 Years
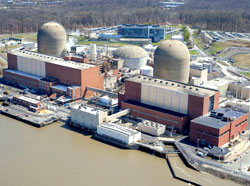
Indian Point – New York
New York 4 Plant SUNF total – 4,381
State Potential Energy + 409 Years
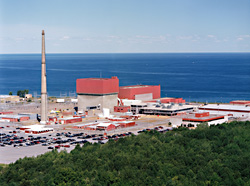
James FitzPatrick – New York
Nine Mile Point – New York
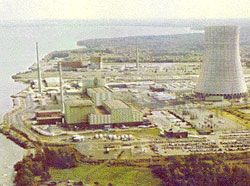
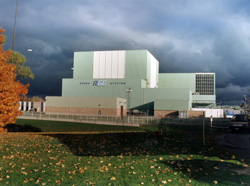
RE Ginna Nuclear – New York
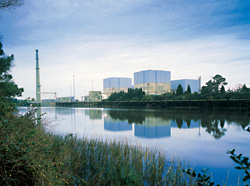
Brunswick – North Carolina
North Carolina 4 Plant SUNF total – 4,346 MT
State Potential Energy + 407 Years
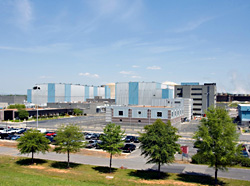
Catawba – North Carolina
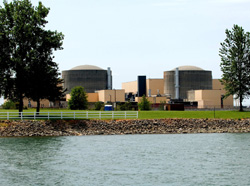
McGuire – North Carolina
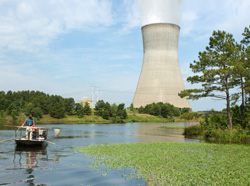
Shearon Harris – North Carolina
Davis-Besse Nuclear – Ohio
Ohio 3 Plant SUNF total – 1,481 MT
State Potential Energy + 152 Years
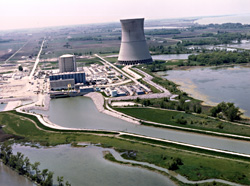
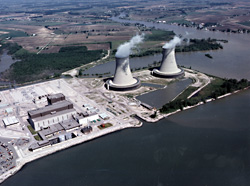
Fermi – Ohio
Perry Nuclear – Ohio
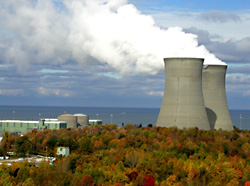
Oregon (Closed)
Oregon SUNF total – 359 MT
State Potential Energy + 71 Years
Beaver Valley – Pennsylvania
Pennsylvania 4 Plant SUNF total – 7,734 MT
State Potential Energy + 415 Years
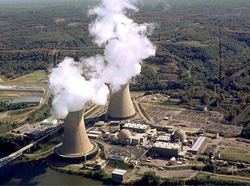
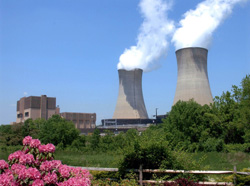
Limerick – Pennsylvania
Peach Bottom – Pennsylvania
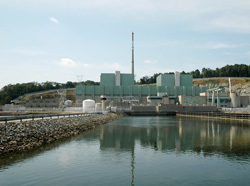
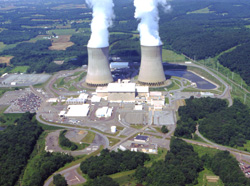
Susquehanna – Pennsylvania
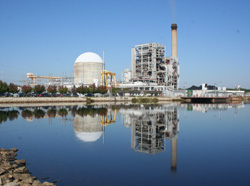
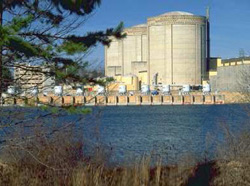
H.B. Robinson – South Carolina
South Carolina 3 Plant SUNF total – 4,948 MT
State Potential Energy + 607 Years
Oconee – South Carolina
Virgil Summer – South Carolina
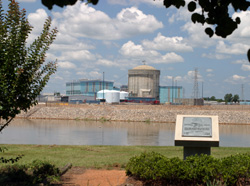
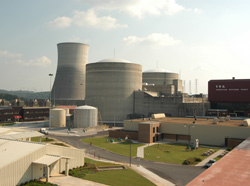
Sequoyah Nuclear – Tennessee
Tennessee 2 Plant SUNF total – 2,275 MT
State Potential Energy + 339 Years
Watts Bar Nuclear – Tennessee
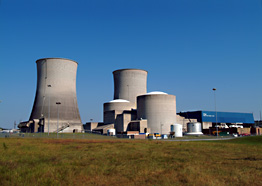
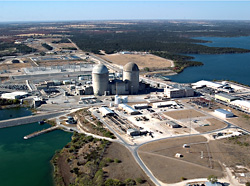
Comanche Peak – Texas
Texas 2 Plant SUNF total – 2,957 MT
State Potential Energy + 75 Years
South Texas Project – Texas
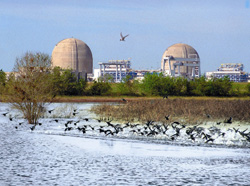
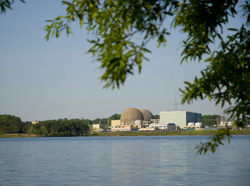
North Anna Nuclear – Virginia
Virginia 2 Plant SUNF total – 3,073 MT
State Potential Energy + 390 Years
Surry Power Station – Virginia
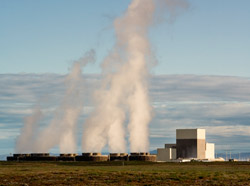
Columbia – Washington
Washington SUNF total – 816 MT
State Potential Energy + 94 Years
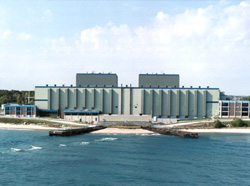
Point Beach Nuclear – WI
State SUNF total – 1,543 MT
State Potential Energy + 302 Years

Want to Learn More – Here are some videos, books and other material to go through (some Free, some not) on our Virginia Recycles SNF site media Tab.